
 Đoàn Lê Minh Anh
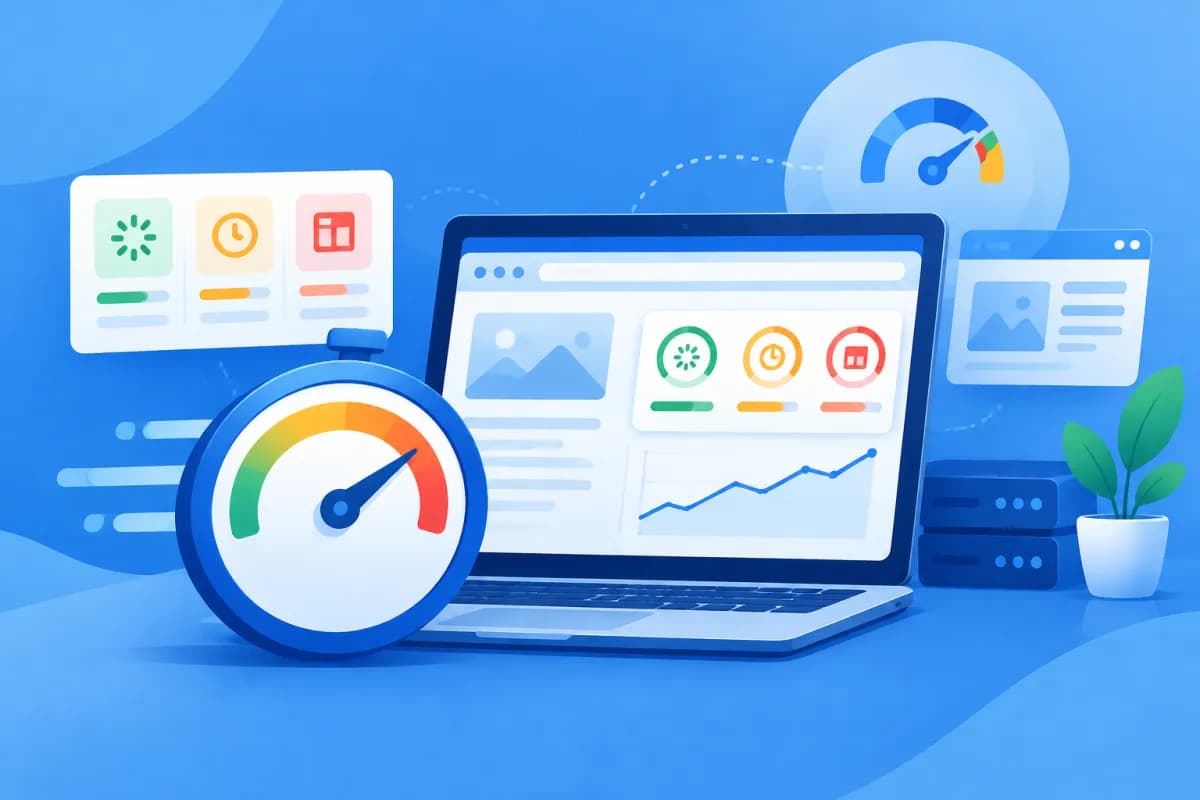
Page speed directly affects user experience, conversion rates, and SEO performance. To find out where a website is fast or slow, businesses can use free Core Web Vitals testing tools to monitor key metrics instead of relying solely on how the site feels when they open it themselves.
This article introduces popular tools for checking LCP, INP, and CLS, and explains how to interpret results and choose the right option. You’ll also learn why lab data can differ from real-user data and how to establish a regular testing process.
What Are Core Web Vitals, and Which Metrics Should You Monitor?
Core Web Vitals are a set of Google metrics that assess several important aspects of the page experience. The three current metrics focus on how quickly the main content appears, how responsive the page is to interactions, and how stable its layout remains. They don’t replace content quality or other SEO factors, but they provide useful signals for identifying technical issues that affect visitors.

- LCP (Largest Contentful Paint): measures how long it takes for the largest content element in the viewport to appear, such as a hero image or large heading. A commonly used target is an LCP of 2.5 seconds or less.
- INP (Interaction to Next Paint): assesses a page’s responsiveness to interactions such as clicking a button, opening a menu, or entering data. A good INP is 200 milliseconds or less. INP has replaced FID in the Core Web Vitals set.
- CLS (Cumulative Layout Shift): measures unexpected movement of elements on a page. A good CLS target is 0.1 or less.
These thresholds are assessed at the 75th percentile: in other words, at least 75% of visits need to meet the corresponding target for a metric to be rated good. So, a high score from a single test doesn’t prove that every visitor has a good experience. Monitor results over time and across devices and page types.
Free Core Web Vitals Testing Tools Worth Using
Google PageSpeed Insights
PageSpeed Insights is a convenient option for quickly checking a URL. It can show real-world data from the Chrome UX Report if the page or website has sufficient data, along with Lighthouse lab data. Results include a performance score, the status of LCP, INP, and CLS, and recommendations such as optimizing images, reducing JavaScript, or eliminating render-blocking resources.

Be sure to distinguish between the two types of data. Real-world data shows how users experienced the page during the recent collection period; Lighthouse data simulates a page load under specific conditions. If real-world data isn’t available, that doesn’t mean the website has no issues: the URL may not have enough visits or may not have corresponding data.
Google Search Console
The Core Web Vitals report in Search Console helps you monitor multiple URLs rather than checking each page individually. It groups pages by status—good, needs improvement, or poor—and typically separates results for mobile and desktop. This is useful for identifying a page type, such as product pages or articles, that has widespread issues.
Search Console is useful for tracking trends and confirming the scope of an issue, but it doesn’t diagnose every cause in detail. If you find a group of URLs with problems, check a representative URL in PageSpeed Insights or Lighthouse, then compare its design pattern and shared components.
Lighthouse in Chrome DevTools
Lighthouse is built into Chrome DevTools, allowing technical teams to run performance checks directly in the browser. You can select a device mode, save reports, and review improvement opportunities by category. The tool is particularly useful during feature development, when you need to check the impact of a change before release.
Lighthouse results are lab data and don’t fully represent every real user. Scores can vary depending on the computer’s configuration, network, browser extensions, and test timing. Run tests several times under comparable conditions, and review both the metrics and specific diagnostics rather than optimizing for a single overall score.
Chrome UX Report and Third-Party Testing Tools
The Chrome UX Report (CrUX) is a source of real-world experience data from Chrome users who have opted to share their data. You can access it through PageSpeed Insights, Search Console, or free tools that use CrUX data. Testing tools such as WebPageTest can also help test page loads and analyze resources; check the free-use limits at the time you use them.
Not every URL has its own CrUX data. In that case, a report may use website-level data or show no real-world data. Check the report’s scope and time period before drawing conclusions. Third-party tools can provide additional insight, but compare their measurement methods and prioritize data sources that fit your goals.
How to Choose a Tool and Interpret Results Correctly
No single tool is right for every situation. Website owners who need to monitor overall site health can start with Search Console. Marketers and content managers can use PageSpeed Insights to check important URLs. Development teams should incorporate Lighthouse into their testing process, while performance specialists can use additional page-load analysis tools to investigate root causes in greater depth.

- Define your goal: Do you need to review real-world experience across multiple pages, diagnose a specific page, or test an update before release?
- Check both mobile and desktop: Traffic, network speeds, and how pages display can differ significantly between the two device groups.
- Review each metric: The overall performance score is only one signal. Identify whether LCP, INP, or CLS is the main issue, then review the relevant recommendations.
- Compare multiple sources: Use real-world data to understand user experience and lab data to reproduce issues and find their causes.
- Record before-and-after results: Save the URL, date and time, device, and results so you can assess changes after fixes.
For example, if LCP is high, check the main content image, server response time, and resources that delay rendering. If INP is poor, look for long-running JavaScript, tasks that block the main thread, or interaction event handling. For CLS, check for images without declared dimensions, ads that change the available space, or content inserted late. Metrics reveal symptoms; to choose the right solution, you need to trace the cause in the context of the specific website.
A Process for Testing and Improving Core Web Vitals
Start by listing pages with high business value, such as the homepage, service pages, product pages, contact forms, and advertising landing pages. Check them with PageSpeed Insights, then review the Search Console report to see whether the issue affects multiple URLs of the same type. This approach helps businesses focus on the right areas instead of trying to fix every page at once.

Once you’ve identified an issue, assign responsibility across marketing, web development, and your infrastructure provider if needed. Make changes by category of root cause, then test again under similar conditions. For real-world data, allow enough time for the systems to update; results don’t necessarily change immediately after implementation.
LilyTech can help businesses assess website performance, identify improvement priorities, and recommend solutions suited to their existing platform. Coordination across content, design, code, and infrastructure is often more important than installing another tool, because every component can affect speed and user experience.
Conclusion: Monitor Regularly for Sustainable Improvement
Free tools such as PageSpeed Insights, Search Console, and Lighthouse help businesses monitor LCP, INP, and CLS from different perspectives. Combine real-world data with simulated testing, assess both mobile and desktop, and prioritize the root causes that have the greatest impact on users. Free Core Web Vitals testing tools are most effective when used as part of a regular measurement process that records results and retests after each round of optimization.

If you need a website assessment or a speed improvement plan tied to your business goals, contact LilyTech for advice. Our team can help identify issues, prioritize next steps, and choose an approach that fits your business resources.

